Shirase Drainage Basin locates in the East Antarctica (37-50°E, 70-78°S), covering an area of 2×10⁵ km2. The basin is characterized by a converging ice flow into Shirase Glacier, one of the fastest flowing glacier in Antarctica. As the glacier calves nearly 90% of total ice discharge from the basin, the converging flow regime and the fast flow feature take a crucial role in the mass budget of this region. To investigate the details of the ice flow regime in Shirase Drainage Basin, we initiated a project to develop a thermo-mechanical coupled 3D ice sheet model, which solves the full Stokes equation with the finite element method.
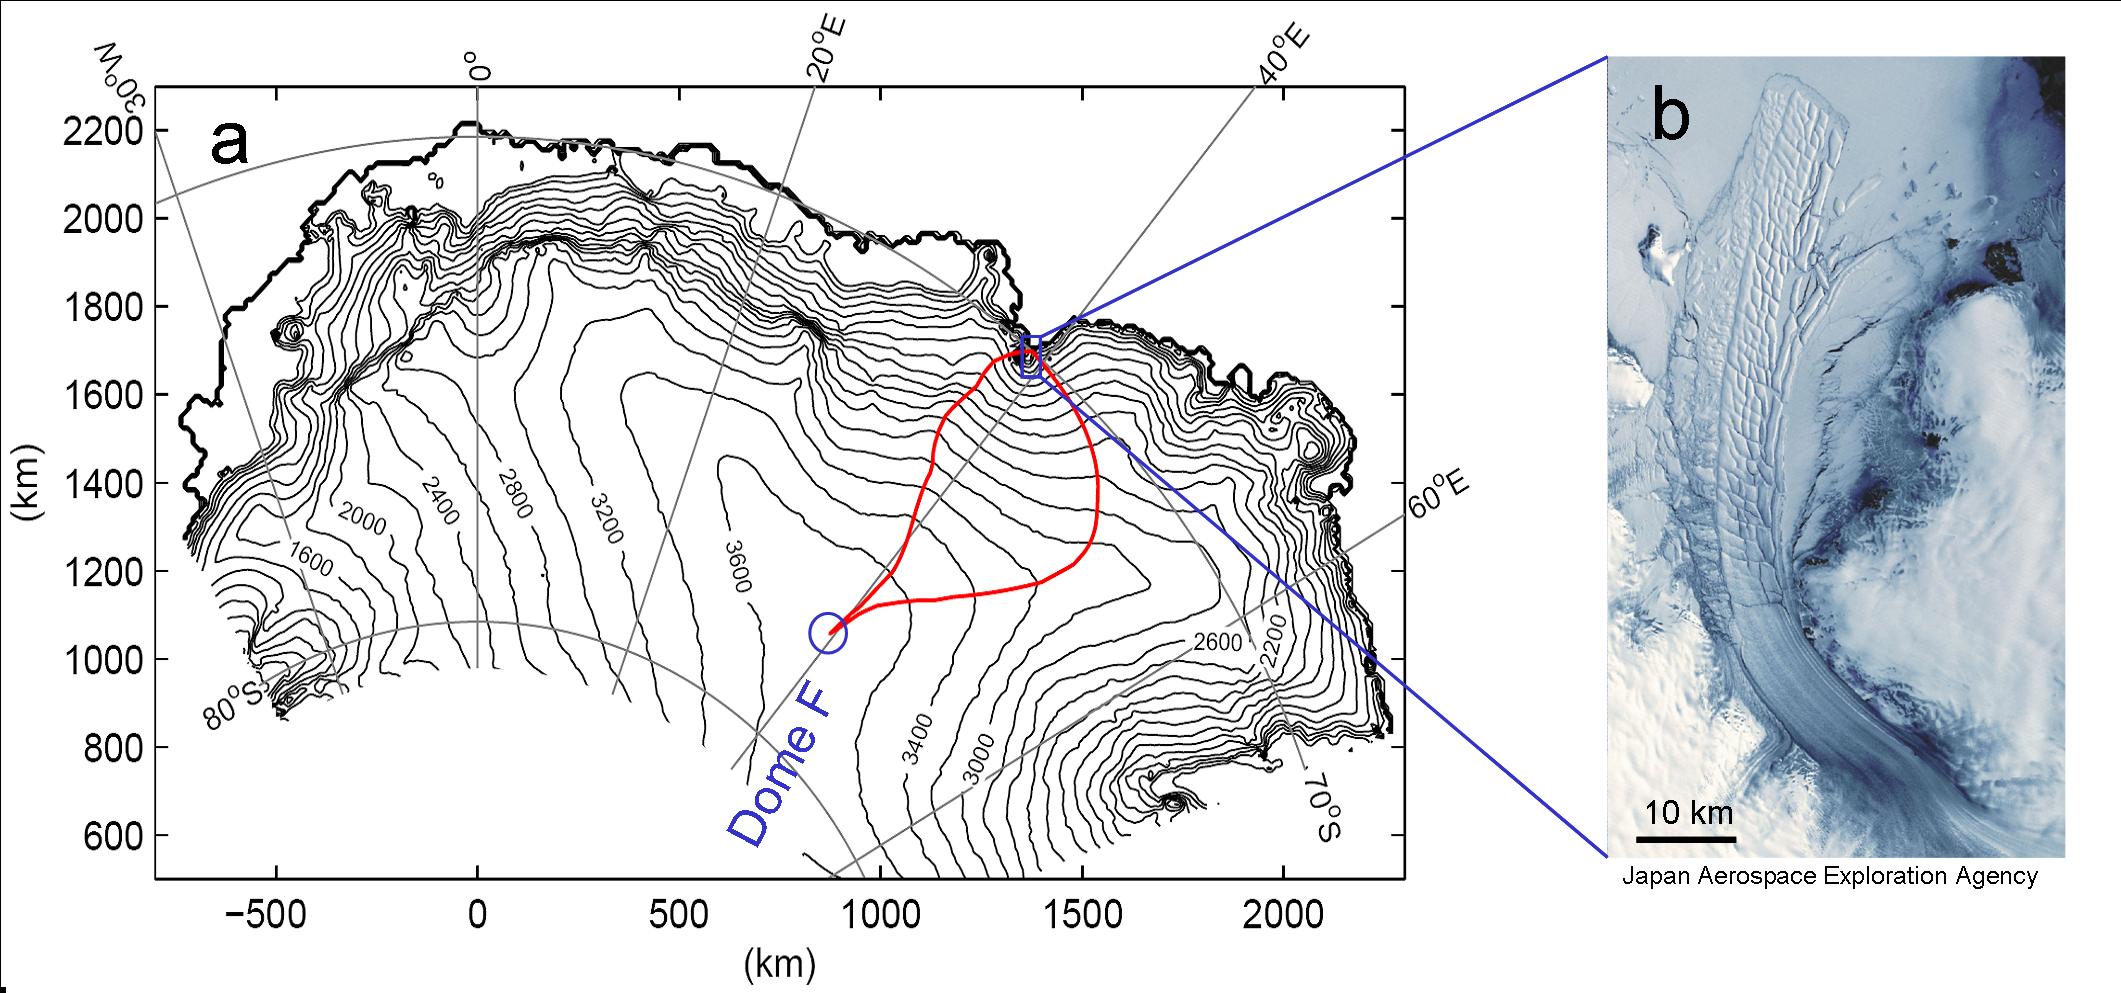
Figure 1. (a) Shirase Drainage Basin outlined by the red line and (b) the satellite image of Shirase Glacier.
Model
-Full Stokes ice dyanamics coupled with thermodynamics
-Glen's flow law: n=3, A=A0exp(-Q/RT), EF=3.0
-Geothermal heat flux: 60 mW m-2
-Ts : from -53.5 to 0 C as a function of latitude and elevation
-BEDMAP geometry data (Lythe and others, 2001)
-Finite element solver Elmer/Ice (http://www.csc.fi/elmer)
-Finite element mesh with 5-20 km resolutions and 15 layers
-Diagnostic simulation
-Non slip bed boundary condition
-Fixed side boundary condition
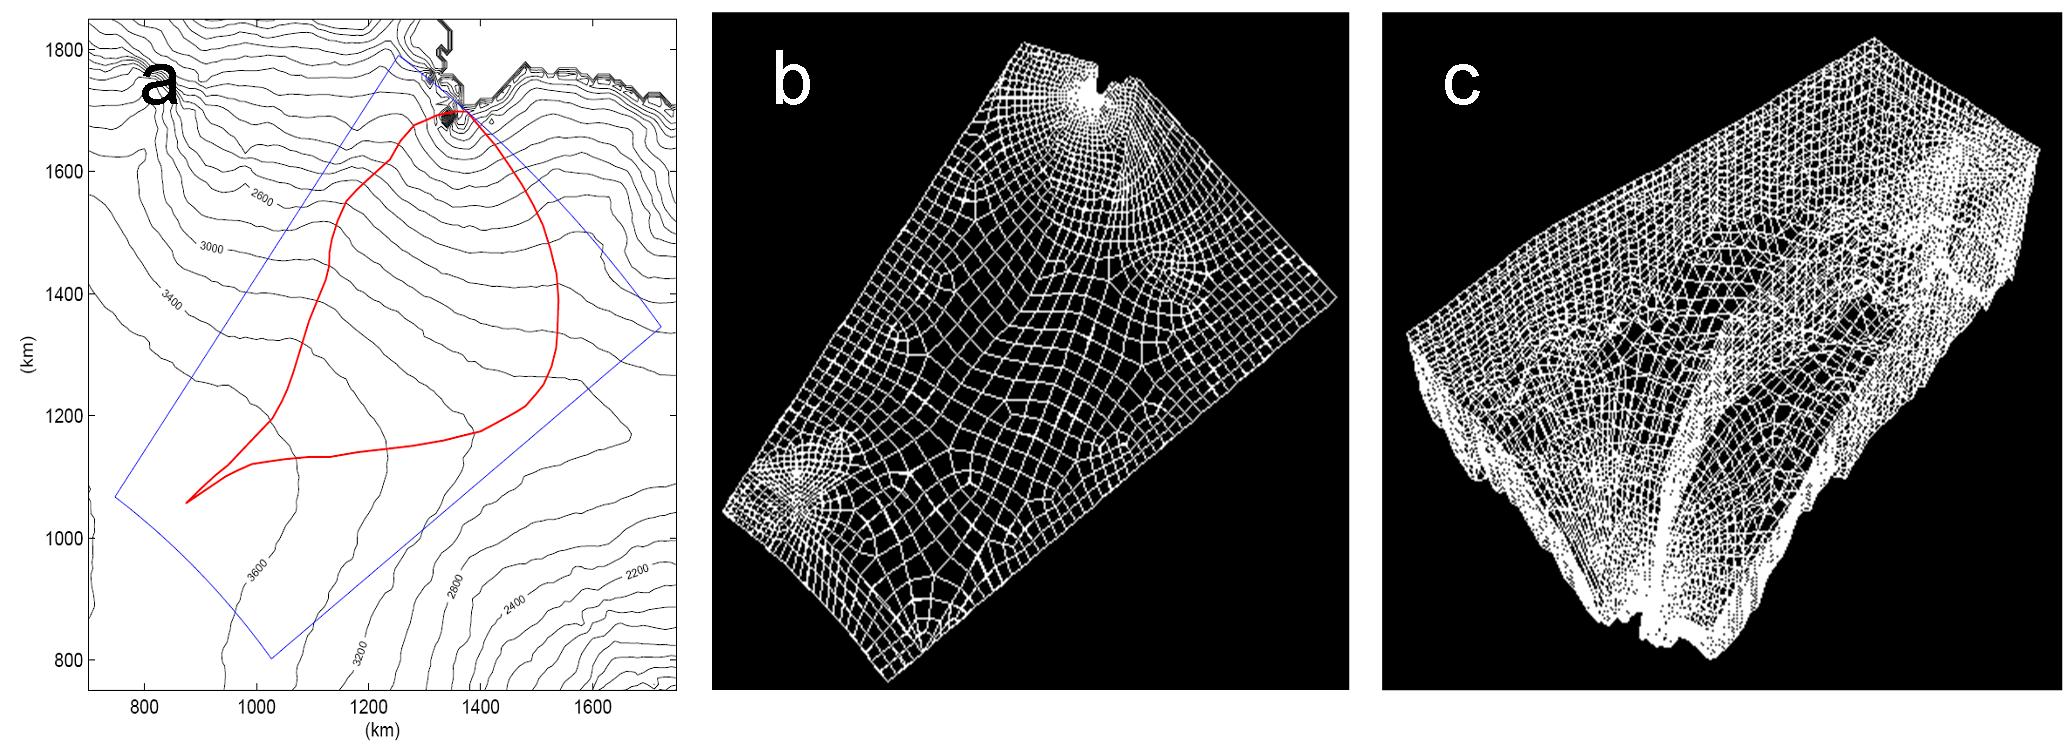
Figure 2. (a) Modelled domain outlined by the blue line and (b and c) 3D finite element mesh.
Preliminary Results
Three dimensional distributions of ice flow and temperature fields were obtained by the model computation (Figure 3). The bed temperature shows that melting occurs at about 50% of the model domain (Figure 3 b). This result agrees with the melting bed condition confirmed at Dome F by the deep ice core drilling and suggested in the lower region by ice radar measurements (Mae and Yoshida, 1987).
The surface flow direction agrees with the observational data reported by Motoyama and others (2008). In general, the ice flow feature converging into Shirase Glacier is well reproduced by the model (Figure 4a). The computed surface speed consistently exceeds the observations in the upper reaches closer to Dome F, whereas it is too small in the lower region (Figure 4b).
The underestimation of the speed by the non slip experiment implies the importance of basal ice motion in the lower half of the drainage basin. The discrepancy between the computed and observed speed increases at the point about 600 km from Dome F (Figure 4c). From this point, the bed elevation drops and it becomes below sea level at the last 100 km. Such basal geometry may play a role in the progressively increasing flow speed towards the coast. The model results confirm that the very fast ice flow near the grounding line (>2,000 m a-1) is entirely due to basal motion.
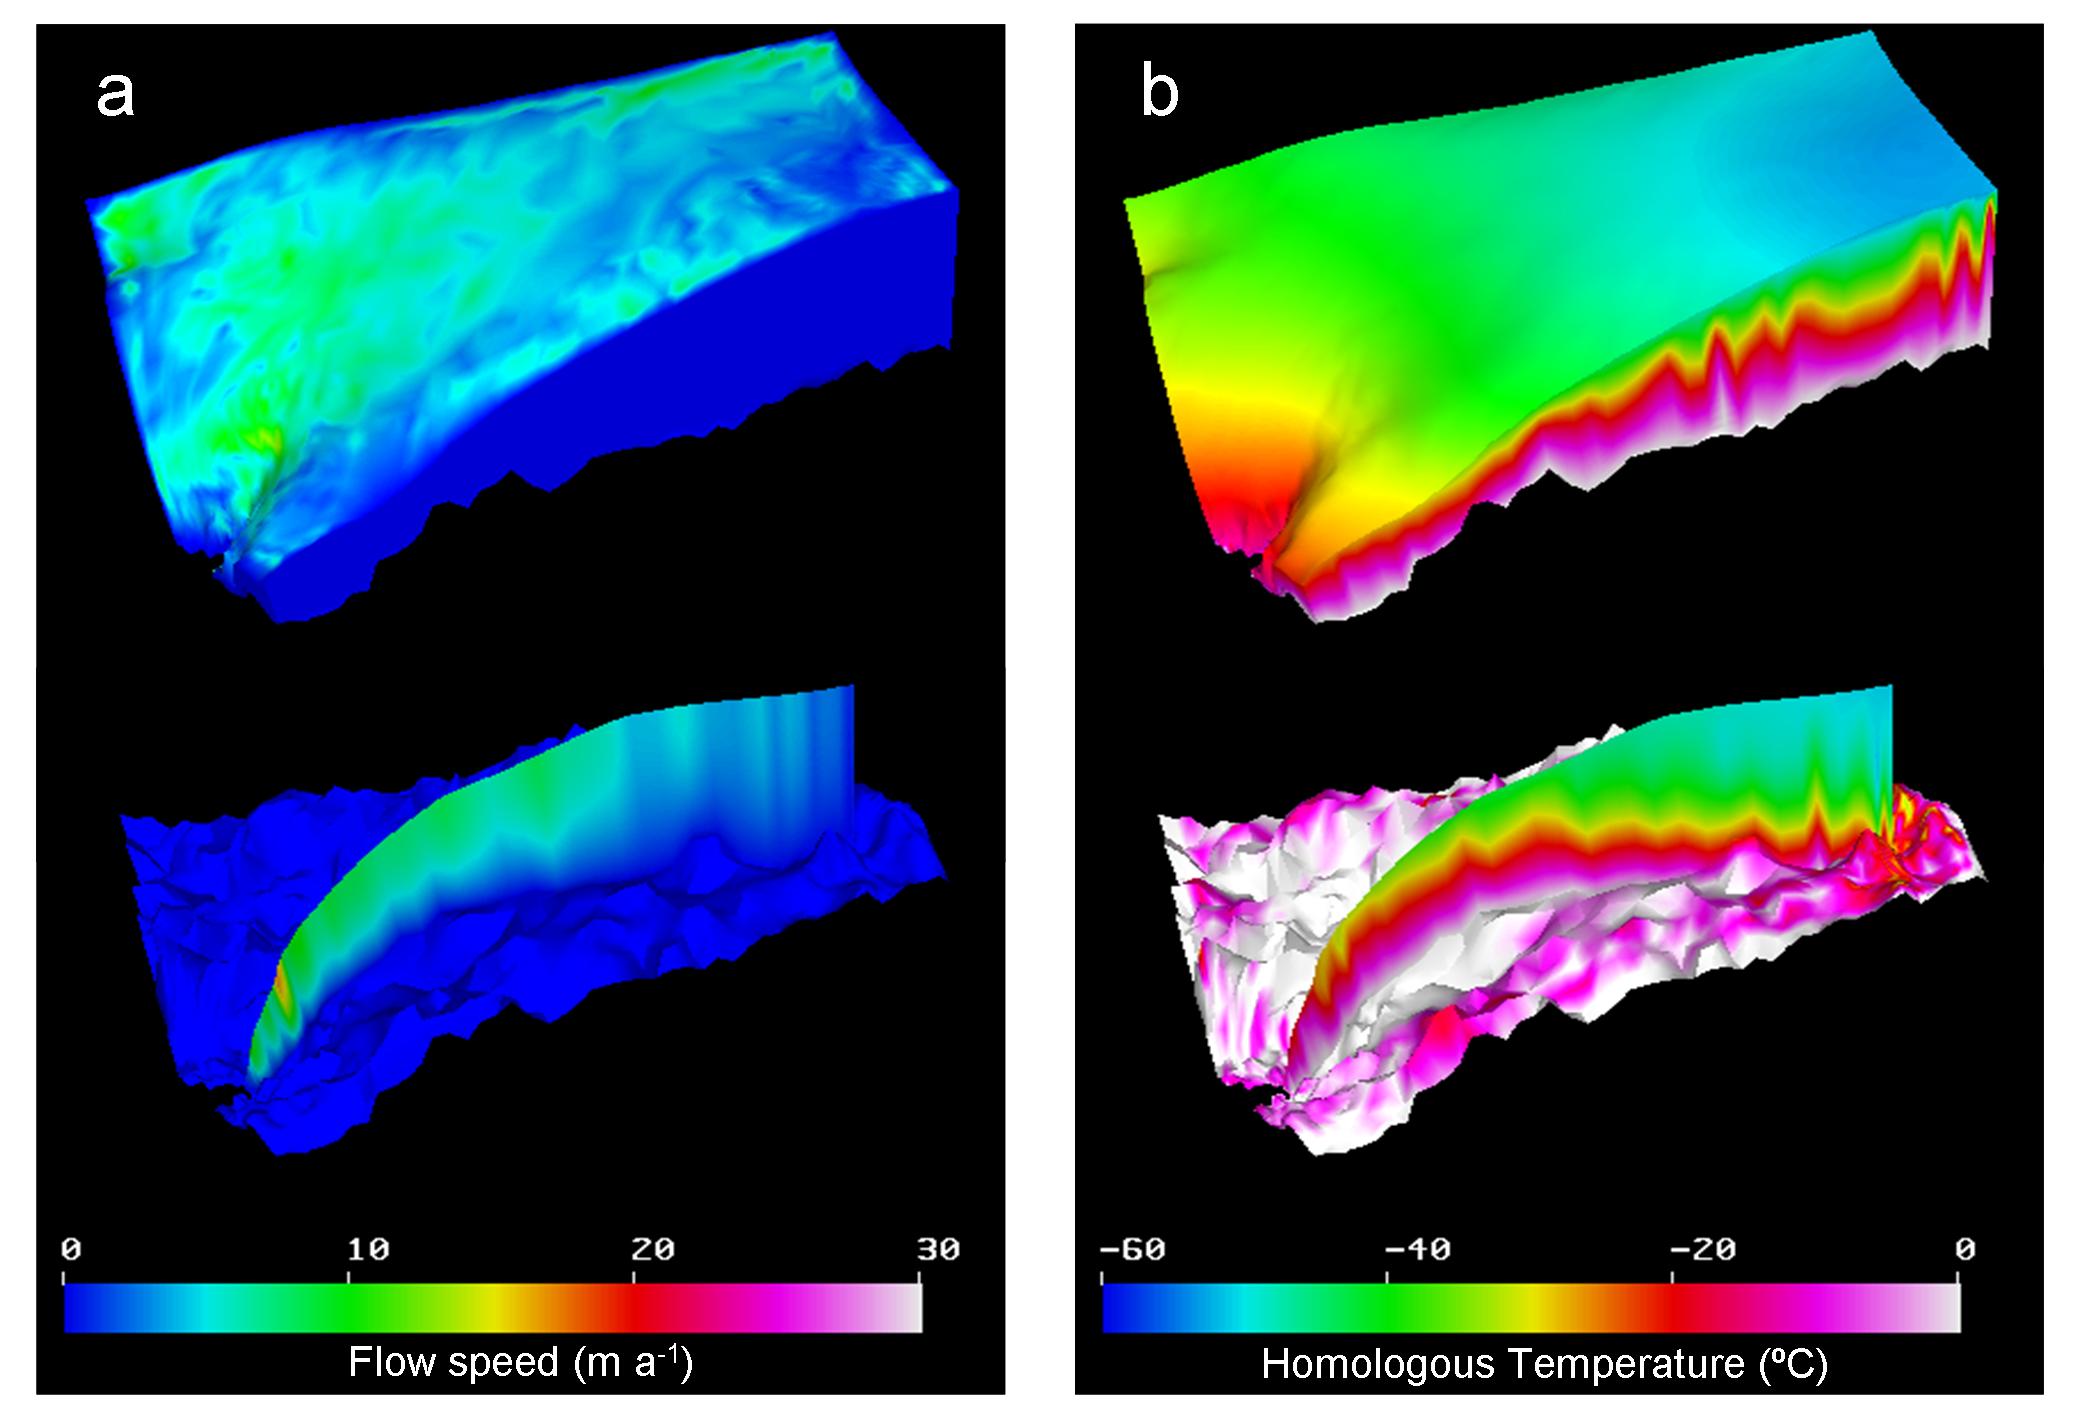
Figure 3. Computed (a) velocity and (b) temperature fields.
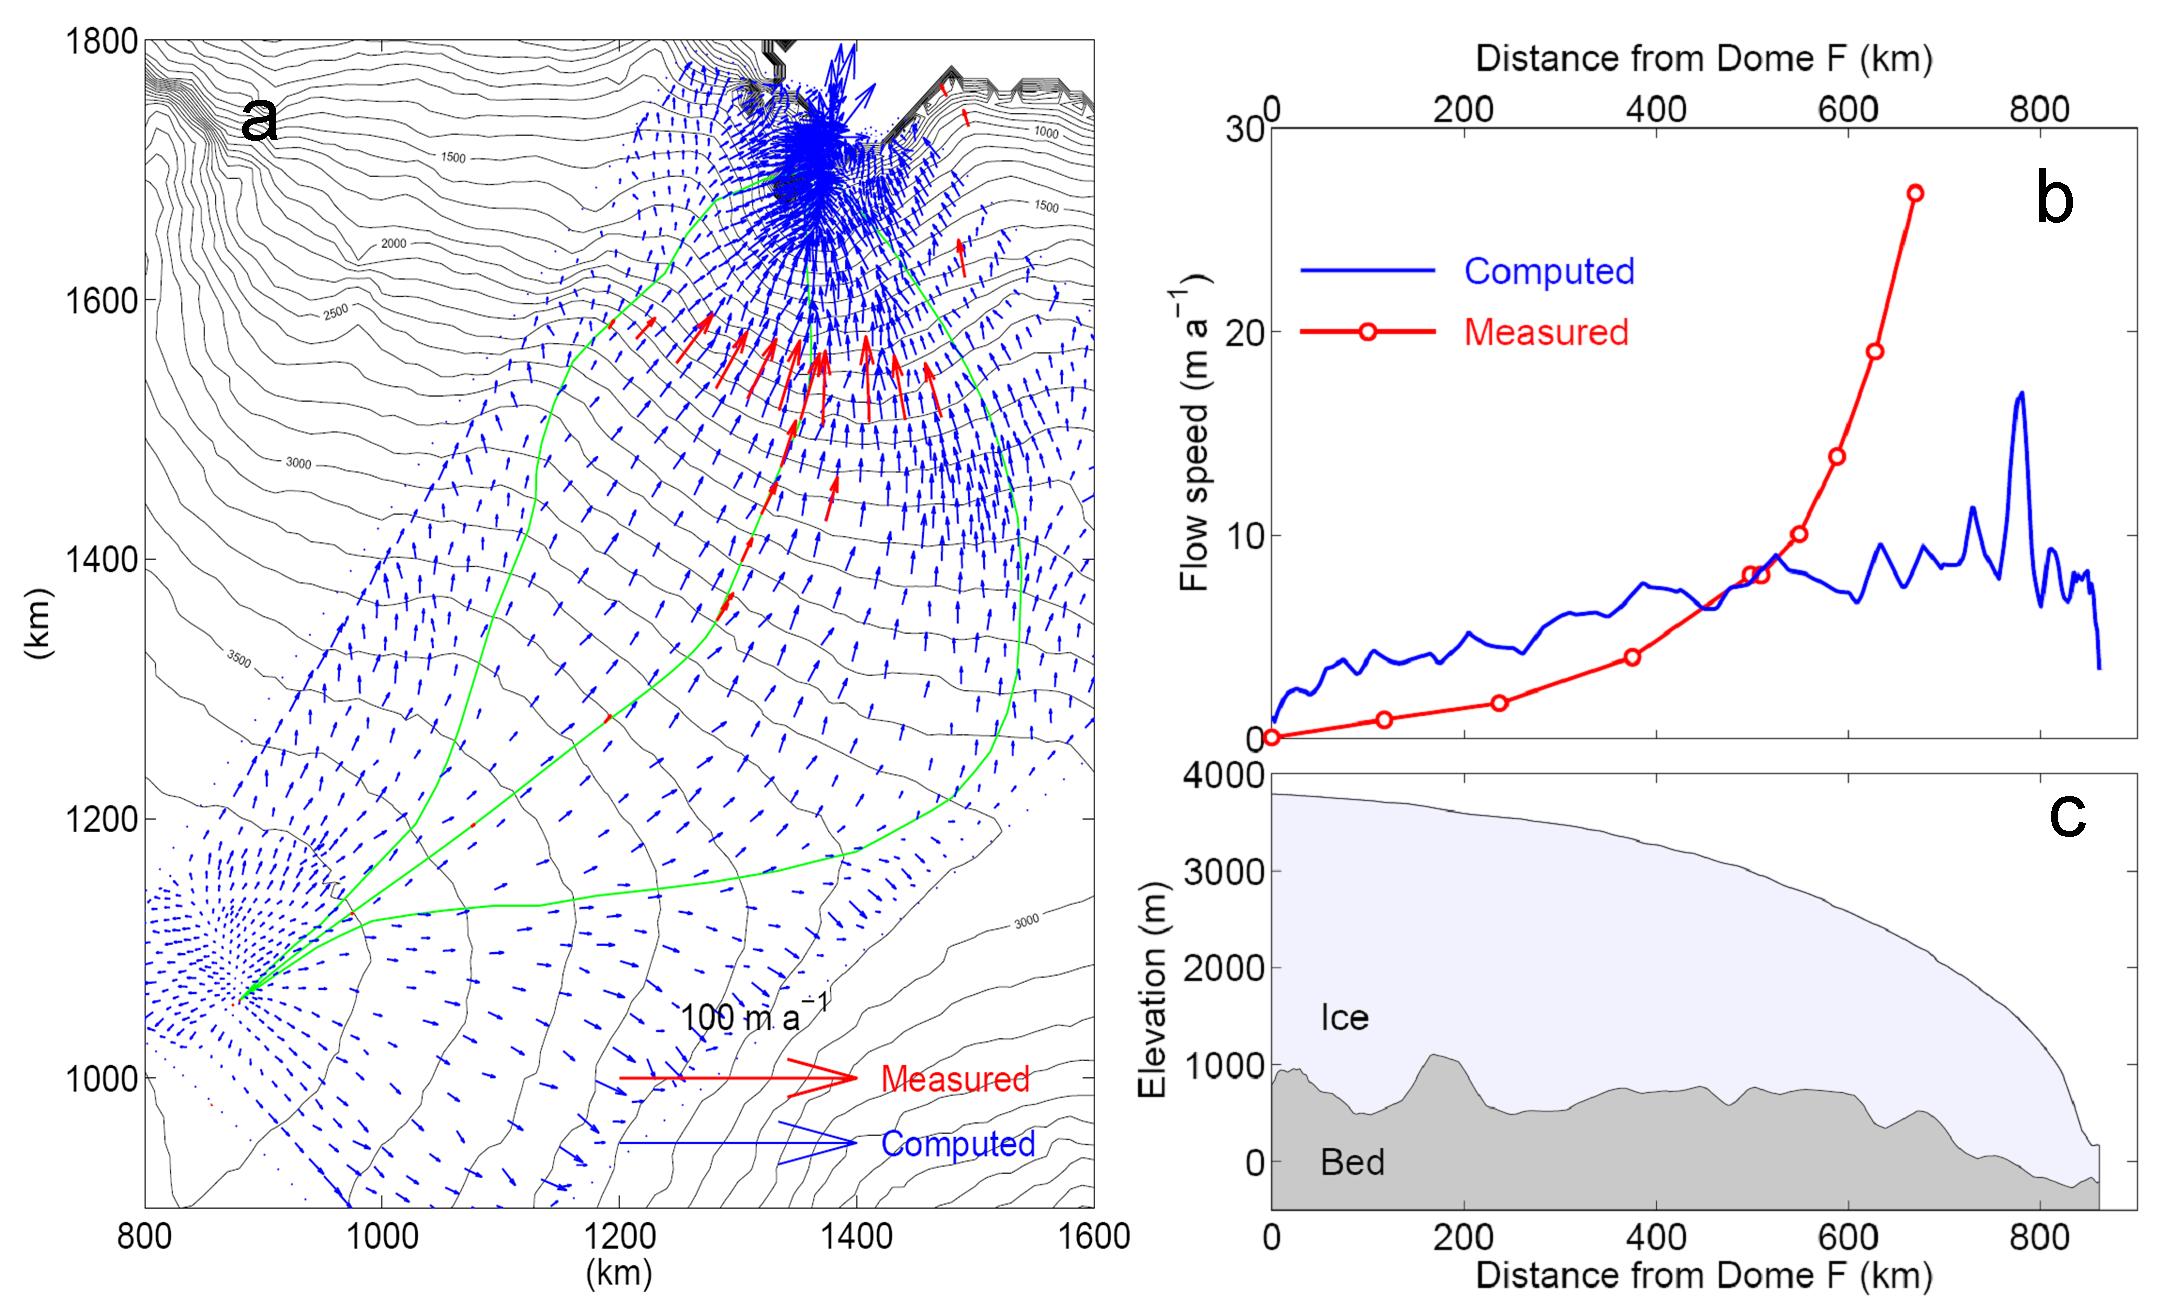
Figure 4. (a) Computed and measured surface flow vectors. (b) Velocity and (c) surface and bed elevation along the flow line.
References
-Motoyama, H., T. Furukawa and F. Nishio. 2008. Antarctic Record, 52, 216-231.
-Lythe, M. B., D. G. Vaughan and the BEDMAP Consortium. 2001. J. Geophys. Res., 106(B6), 11,335-11,351.
-Fujii, Y. 1981. Antarctic Record, 72, 1-15.
-Rignot, E. 2002. Ann. Glaciol., 34, 217-227.
-Pattyn, F. and D. Derauw. 2002. J. Glaciol., 163(48), 559-565.
-Nakamura, K., K. Doi and K. Shibuya. 2007. Polar Science, 1, 73-83.
-Mae, S. and M. Yoshida. 1987. Ann. Glaciol., 9, 160-165.